Schemata Screen Shots
Spice commands are executing in the bottom left window, the graphs show the results. Note the annotation of the operating points. The outline on the top right shows the simulation – we in one of the debug simulations in the AC tests of the device. The actual script running is shown in to the window above the schematic
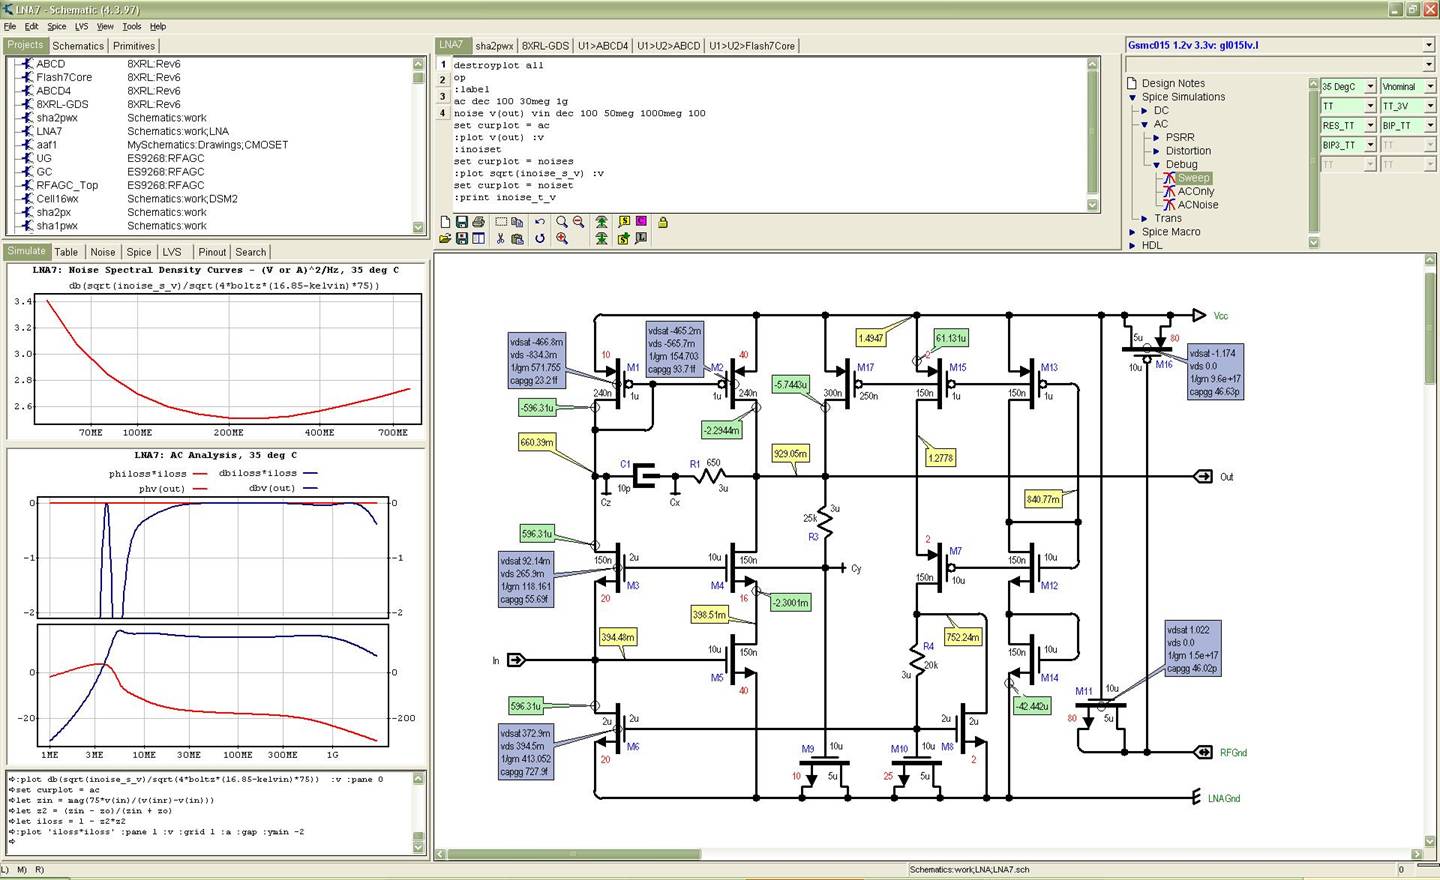
A click on the “noise” tab shows the noise contribution of individual devices.

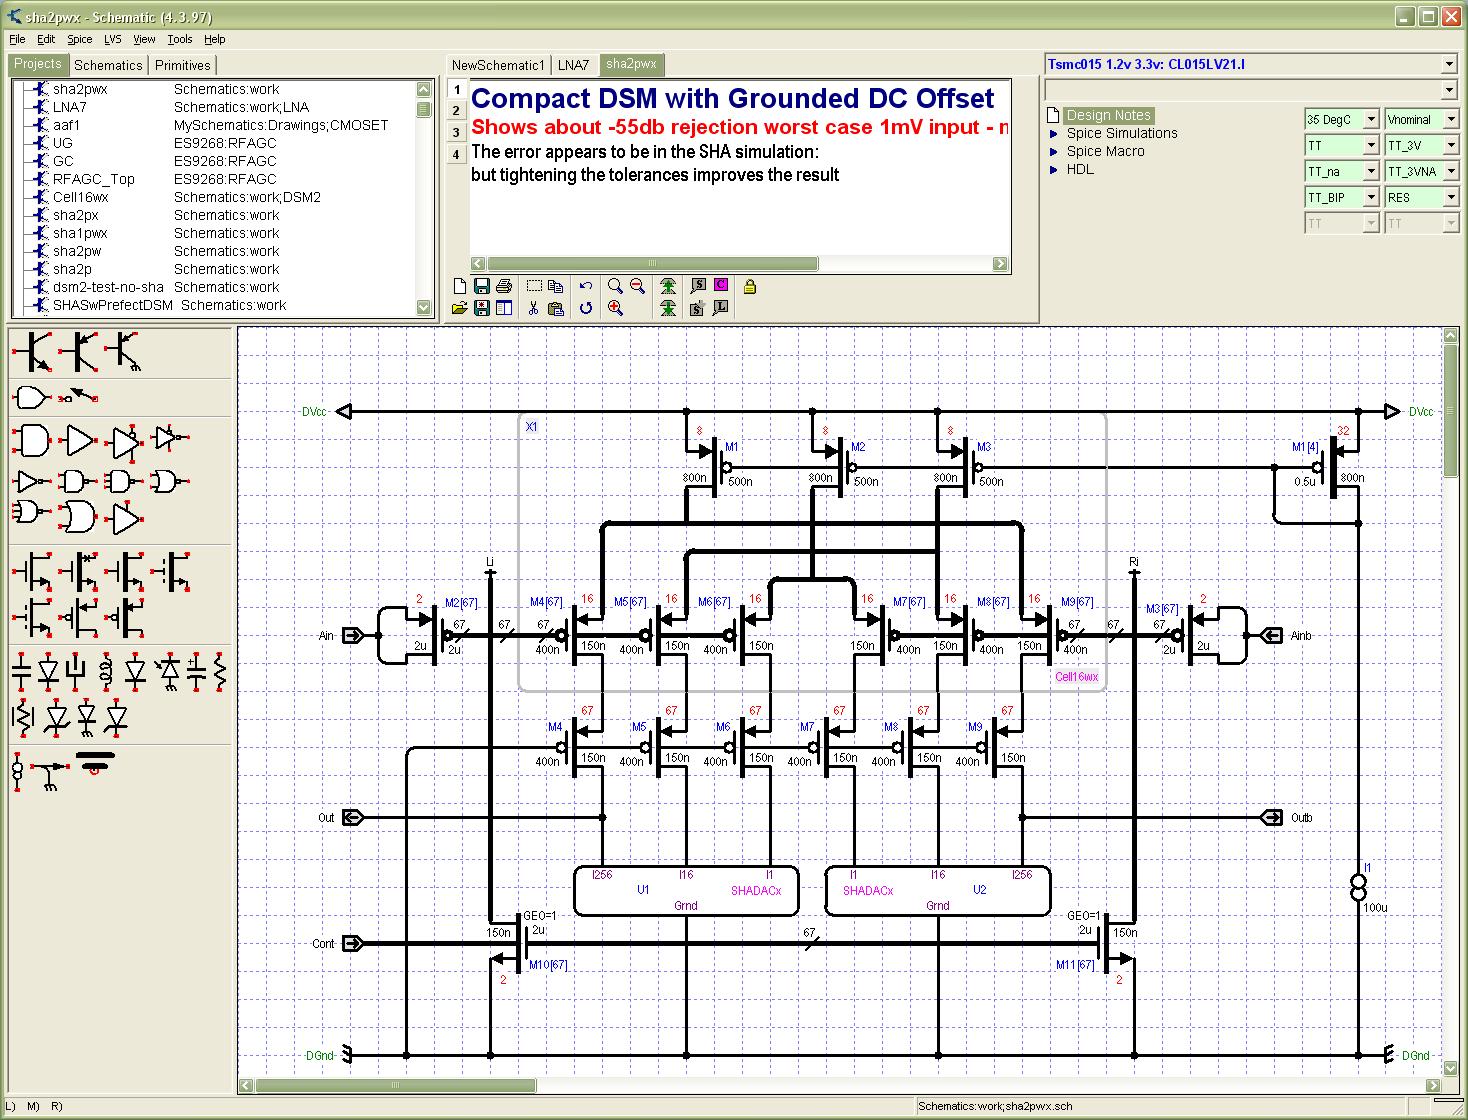
A slightly different configuration can be used when drawing the schematic – here the primitives are available to drag from a table on the left… note the transparent icon X1.
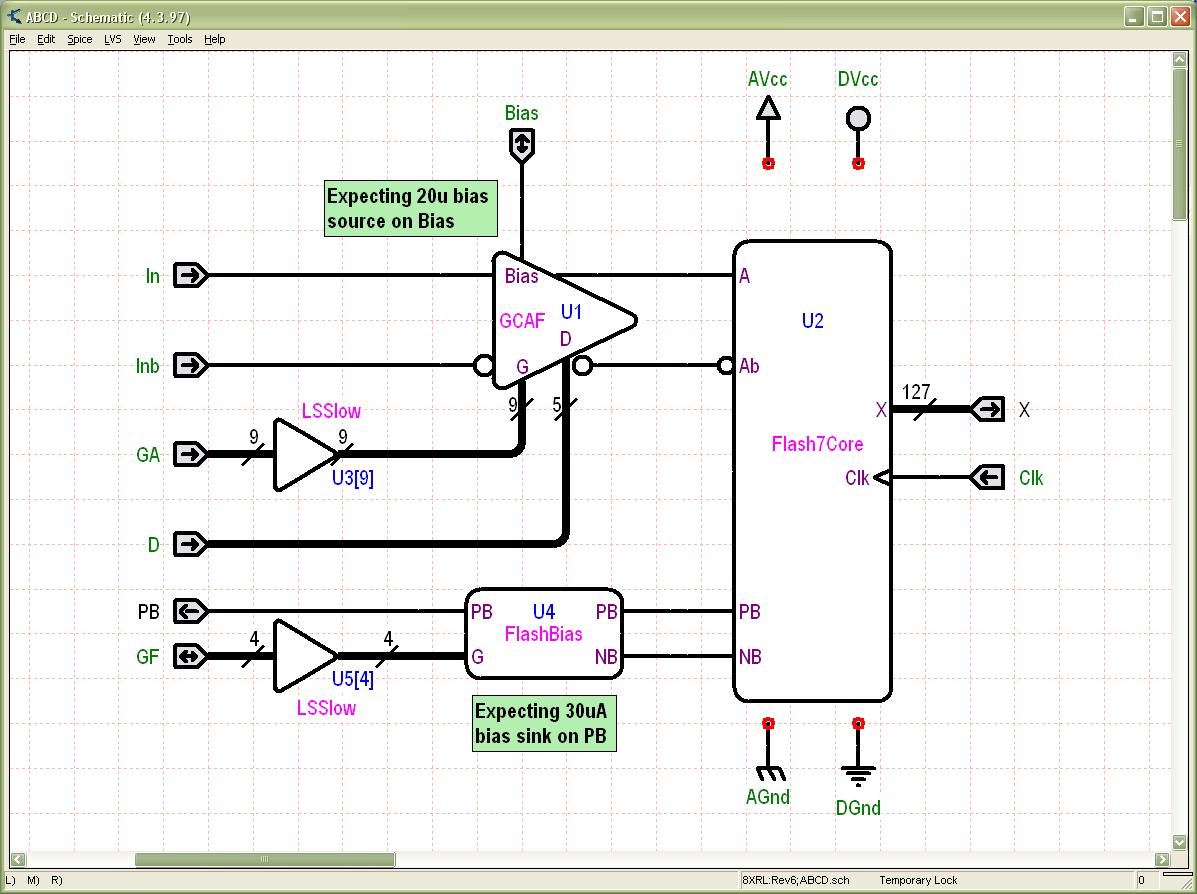
It is possible to work in a mode where the whole window is the schematic – this helps when reviewing a large design.